
Docs /Engineering Workflow
Visualizing Results
After your simulation completes, LeaRes provides 3D visualization tools to explore the flow field. This tutorial covers loading results, coloring scalar and vector fields, using Surface LIC for flow visualization, clipping the geometry, and animating through time frames.
Loading Simulation Results
Step 1: Find the Completed Job
- Open the Simulations section for your project version
- Locate the job that has reached 100% (
job_N 100%)
Step 2: Load the Results
- Click the completed job
- The results load into the 3D viewer
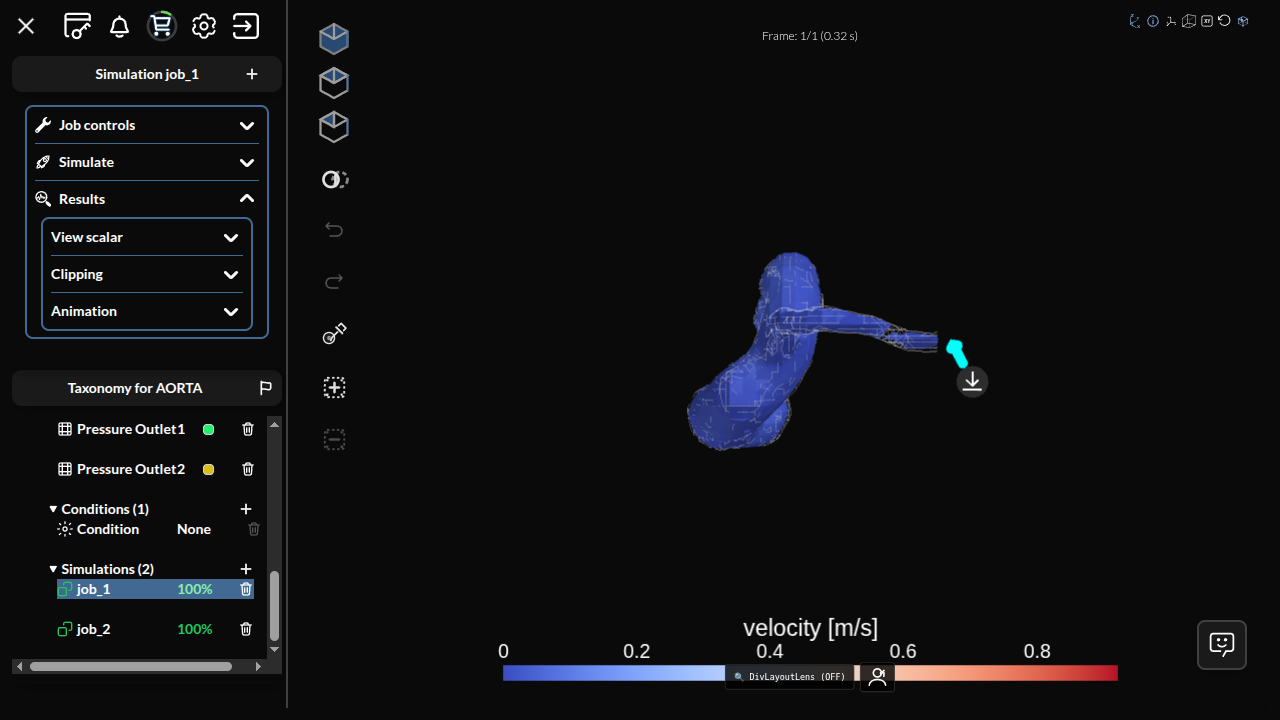
Coloring by Scalar and Vector Fields
Pick the field from the data array dropdown in the results toolbar, then choose a colormap. Which fields are available depends on the project’s flow type:
| Flow type | Fields |
|---|---|
| Internal / External | velocity [m/s], pressure [Pa], vorticity [Hz], shear stress [Pa] |
| Dispersion | the above + concentration [mol/L] |
| Thermal | the above + temperature [Celsius], heatflux [W/m2] |
| Biphasic | the above + density [Kg/m3] |
Wall shear stress and vorticity are available in every internal-flow project and are often the two most informative fields in a vascular study — do not stop at velocity and pressure.
Display controls
Alongside the field and colormap you have:
- Log scale — for fields spanning orders of magnitude
- Lock range — freeze the colour range so frames stay comparable while animating
- Opacity — see internal structure through the surface
Choosing a Colormap
LeaRes offers a large set of color lookup tables. Common choices include:
- CoolToWarm — diverging blue-to-red, good for pressure
- Viridis — perceptually uniform and colorblind-friendly
- Jet — high dynamic range, classic for velocity
- Turbo — improved rainbow with better perceptual properties
Tip: For publication figures, prefer perceptually uniform maps like Viridis or Turbo over the classic rainbow, which can mislead the eye.
Next Steps
Continue to Surface LIC, Clipping, and Animation.